Publication Tables with maketables#
Empirical papers need tables that present treatment effect estimates alongside standard errors, confidence intervals, and model metadata in a format that journals accept directly. maketables is a Python library for building publication-quality tables from estimation results, with output to LaTeX, HTML, Word, and Typst.
ModernDiD integrates with maketables through a
plug-in interface, so every result object returned by ModernDiD estimators
(aggte, drdid,
cont_did, did_multiplegt, etc.)
can be passed directly to
maketables.ETable
without writing custom extractors.
The plug-in interface handles all the extraction for you. Point estimates,
standard errors, confidence intervals, sample sizes, control group labels,
and SE types are pulled from the result object automatically. ETable
produces a complete, ready-to-submit table from a single call. For more
involved layouts, MTable gives full control over panels and column
spanners. And even if you prefer to fine-tune the raw output yourself,
tab.make() gives you a well-structured starting point in LaTeX, HTML,
Word, or Typst so you never have to build a table from scratch.
Installation#
maketables is not included with moderndid and must be installed
separately:
uv pip install maketables
Plug-in interface#
No manual extraction is required. Every result object returned by a
ModernDiD estimator already knows how to present itself to
maketables. You pass the result directly to ETable and maketables
reads the estimates, standard errors, confidence intervals, and model
metadata automatically.
Under the hood, each result class implements a small set of attributes that maketables discovers at runtime.
__maketables_coef_table__provides a pandas DataFrame with columnsb(estimate),se(standard error),t(t-statistic),p(p-value), and optionallyci95l,ci95u(confidence interval bounds). Each row is a coefficient.__maketables_stat__(key)returns model-level statistics by key, such as"N"(observations),"se_type"(analytical or bootstrap),"control_group", or"aggregation".__maketables_depvar__returns the dependent variable label for column headers.__maketables_vcov_info__returns metadata about variance estimation (type and cluster variable).
You never need to call these attributes yourself. ETable handles
standard coefficient tables (one column per model). For custom multi-panel
layouts, use MTable, the base class that ETable inherits from
(see Custom layouts with MTable below).
If you are adding maketables support to a new estimator, see Maketables Functionality in the architecture guide for implementation details, shared helpers, and a step-by-step walkthrough.
Basics#
The simplest way to get started is to pass a single result to ETable
and call make(). Each result object you include becomes a column in the
output table.
import maketables as mt
import moderndid as did

data = did.load_mpdta()
result = did.att_gt(
    data=data, yname="lemp", tname="year",
    idname="countyreal", gname="first.treat", est_method="dr",
)
event_study = did.aggte(result, type="dynamic")

tab = mt.ETable(
    [event_study],
    coef_fmt="b:.3f* \\n [ci95l:.3f, ci95u:.3f]",
    keep=[r"^Event "],
    model_stats=["N", "se_type"],
    caption="Dynamic Treatment Effects",
)
tab.make("tex")
The coef_fmt string controls how each cell is laid out. Tokens like
b (estimate), se (standard error), ci95l and ci95u
(confidence interval bounds) are replaced with the corresponding values.
Appending * to a token adds significance stars. \\n inserts a line
break within the cell, so "b:.3f* \\n [ci95l:.3f, ci95u:.3f]" places
the starred estimate on one line and the confidence interval below it.
keep filters which rows appear in the table using regex patterns.
model_stats adds a footer panel with statistics like the sample size
and standard error type. model_heads assigns column headers, and
adjacent identical entries merge into column spanners automatically.
See the ETable documentation for the full parameter reference.
Multi-period staggered DiD#
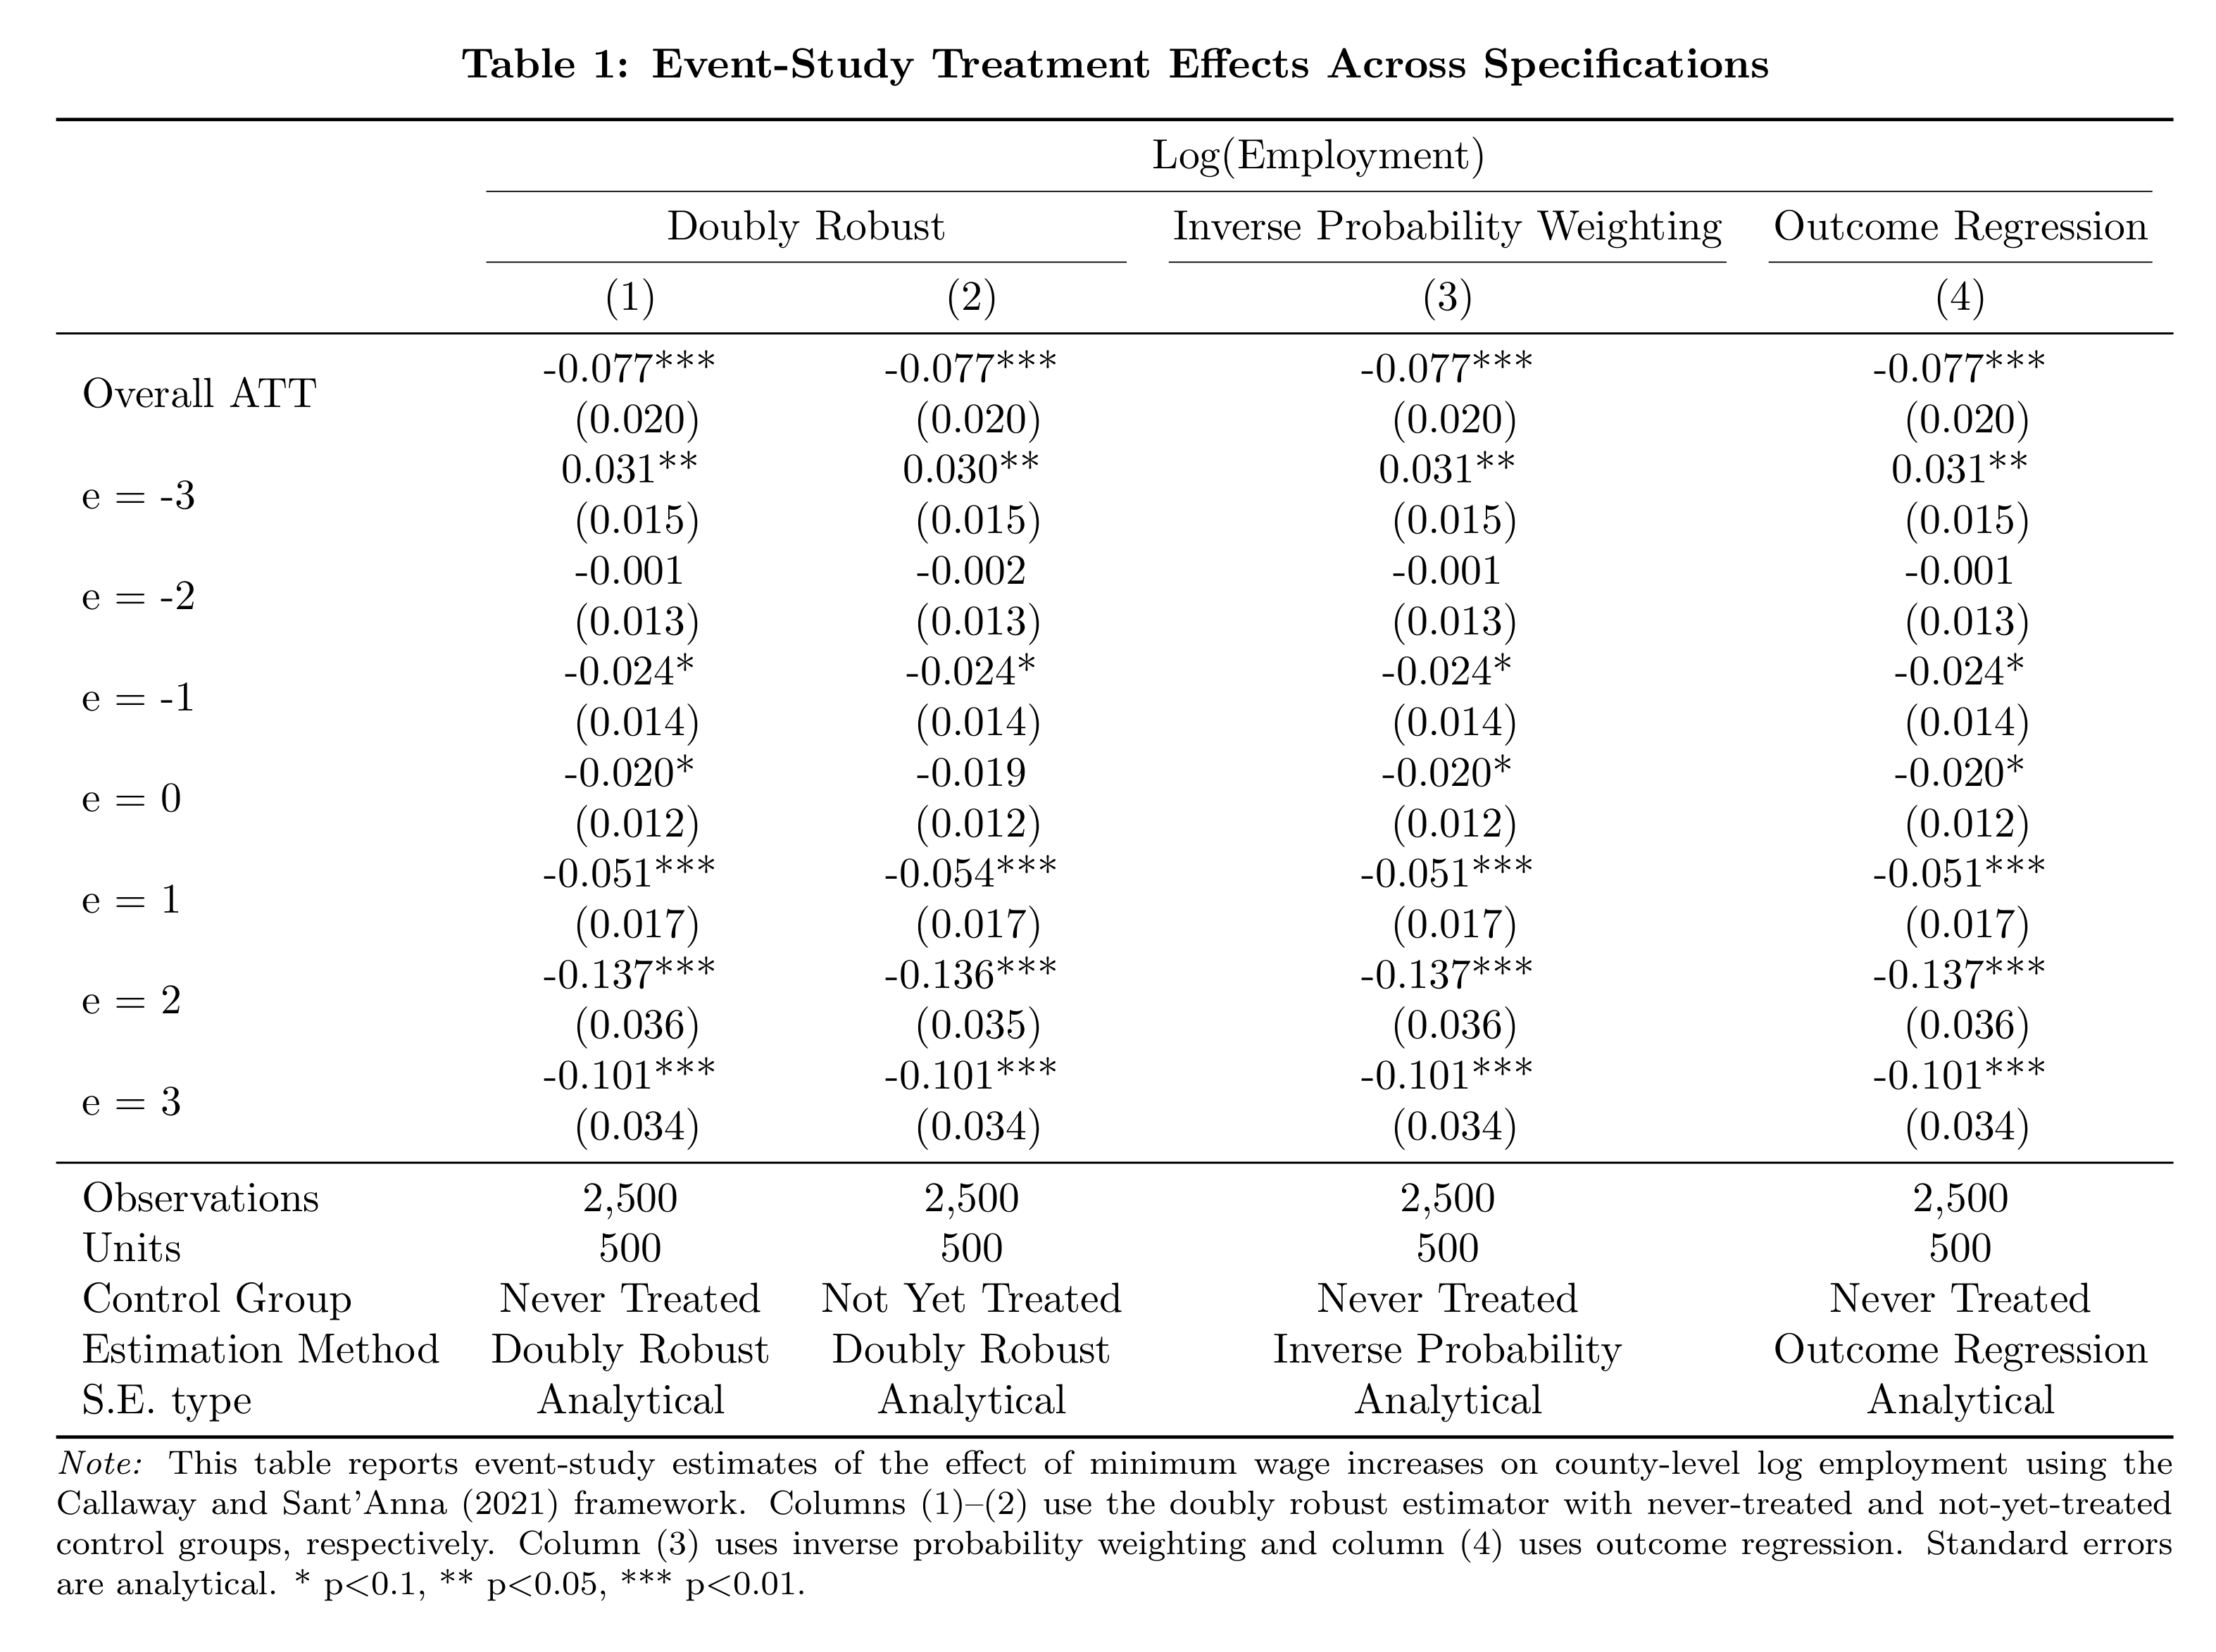
The real power of ETable shows when you compare multiple
specifications side by side. The example below estimates event-study
effects under four different estimation methods, placing them in a
single table with column spanners that group related specifications.
import maketables as mt
import moderndid as did

data = did.load_mpdta()

common = dict(
    data=data, yname="lemp", tname="year",
    idname="countyreal", gname="first.treat",
)
attgt_never = did.att_gt(**common, est_method="dr", control_group="nevertreated")
models = [
    attgt_never,
    did.att_gt(**common, est_method="dr", control_group="notyettreated"),
    did.att_gt(**common, est_method="ipw", control_group="nevertreated"),
    did.att_gt(**common, est_method="reg", control_group="nevertreated"),
]
Then pass the aggregated results to ETable to build a multi-column
comparison table.
tab = mt.ETable(
    [did.aggte(m, type="dynamic") for m in models],
    coef_fmt="b:.3f* \\n (se:.3f)",
    keep=[r"^Overall ATT$", r"^Event "],
    labels={
        "lemp": "Log(Employment)",
        **{f"Event {e}": f"e = {e}" for e in range(-3, 4)},
    },
    model_heads=["Doubly Robust", "Doubly Robust", "Inverse Probability Weighting", "Outcome Regression"],
    head_order="dh",
    model_stats=["N", "n_units", "control_group", "estimation_method", "se_type"],
    model_stats_labels={
        "n_units": "Units",
        "control_group": "Control Group",
        "estimation_method": "Estimation Method",
    },
    caption="Table 1: Event-Study Treatment Effects Across Specifications",
    notes=(
        "\\emph{Note:} This table reports event-study estimates of the effect of "
        "minimum wage increases on county-level log employment using the Callaway "
        "and Sant'Anna (2021) framework. Columns (1)--(2) use the doubly robust "
        "estimator with never-treated and not-yet-treated control groups, "
        "respectively. Column (3) uses inverse probability weighting and column "
        "(4) uses outcome regression. Standard errors are analytical. "
        "* p$<$0.1, ** p$<$0.05, *** p$<$0.01."
    ),
)
tex = tab.make("tex")
The two “Doubly Robust” columns merge under a shared spanner, and the footer reports control group, estimation method, and SE type for each specification.
ETable customization#
ETable offers several options for controlling which rows appear, how
they are labeled, and what metadata is shown. The snippets below use
variables from the examples above.
Coefficient selection and ordering#
Use keep with regex patterns to select rows, order to control the
display order, and exact_match=True for literal name matching.
tab_event = mt.ETable(
    [event_study],
    coef_fmt="b:.3f* \\n [ci95l:.3f, ci95u:.3f]",
    keep=[r"^Event -1$", r"^Event 0$", r"^Event 1$"],
    order=["Event -1", "Event 0", "Event 1"],
    exact_match=True,
)
Labels and header levels#
Use labels to rename coefficient rows and the dependent variable. Use
head_order to control which header levels appear: "dh" shows both the
dependent variable and model headers, "h" shows model headers only, and
"d" shows only the dependent variable.
es_never = did.aggte(attgt_never, type="dynamic")

tab = mt.ETable(
    [es_never],
    coef_fmt="b:.3f* \\n (se:.3f)",
    keep=[r"^Overall ATT$", r"^Event "],
    labels={
        "lemp": "Log(Employment)",
        **{f"Event {e}": f"e = {e}" for e in range(-3, 4)},
    },
    head_order="dh",
)
Column spanners#
Adjacent identical entries in model_heads merge into column spanners
with cmidrules in LaTeX. This groups related specifications under a shared
header.
event_studies = [did.aggte(m, type="dynamic") for m in models]

tab = mt.ETable(
    event_studies,
    coef_fmt="b:.3f* \\n (se:.3f)",
    model_heads=["Doubly Robust", "Doubly Robust", "Inverse Probability Weighting", "Outcome Regression"],
)
Significance stars#
The default cutoffs are [0.01, 0.05, 0.10]. Pass custom cutoffs or
an empty list to disable stars entirely.
# Custom cutoffs
tab = mt.ETable([event_study], signif_code=[0.001, 0.01, 0.05])

# No stars
tab = mt.ETable([event_study], signif_code=[])
Custom model statistics#
custom_model_stats adds extra rows to the bottom panel with
user-provided values. This is useful for reporting statistics not
exposed by the plug-in interface.
overall = [did.aggte(m, type="simple") for m in models[:2]]

tab = mt.ETable(
    overall,
    coef_fmt="b:.3f* \\n (se:.3f)",
    keep=[r"^Overall ATT$"],
    model_stats=["N", "se_type"],
    custom_model_stats={
        "Pre-trend p-value": ["0.412", "0.387"],
        "Covariates": ["No", "Yes"],
    },
)
Table metadata#
caption, tab_label, and notes control the table title,
LaTeX label for cross-referencing, and footnote text.
tab = mt.ETable(
    overall,
    coef_fmt="b:.3f* \\n (se:.3f)",
    keep=[r"^Overall ATT$"],
    model_heads=["Never Treated", "Not Yet Treated"],
    caption="Main Results",
    tab_label="tab:main-results",
    notes="Standard errors in parentheses.",
    model_stats=["N", "control_group", "se_type"],
    model_stats_labels={"control_group": "Control Group"},
)
Custom layouts with MTable#
ETable automatically extracts coefficients and statistics from model
objects through the plug-in interface: each result becomes a column, and
maketables handles the formatting. This works well for standard coefficient
tables. For layouts that don’t fit this pattern (multi-panel robustness
tables, correlation matrices, custom summary statistics), MTable
provides full control.
MTable is the base class that ETable inherits from. Rather than
extracting from model objects, it takes a pandas DataFrame as input and
formats it into a publication-quality table. You build the DataFrame yourself,
giving you complete control over row structure, column layout, and cell
content.
Row and column structure#
MTable uses pandas MultiIndex to create table structure:
Row MultiIndex: A two-level
MultiIndexon the row axis creates panel groupings. The first level becomes a row-group header; the second level becomes the row label. Setrgroup_display=Trueto show the panel headers andrgroup_sep="tb"to add horizontal rules between panels.Column MultiIndex: A
MultiIndexon the column axis creates column spanners with cmidrules in LaTeX. Adjacent columns under the same top-level label are grouped automatically.Cell content: Cells are pre-formatted strings. Newlines (
\n) in cell values render as\makecell{}in LaTeX and line breaks in HTML, so you can stack estimates and standard errors in a single cell.
The tex_style dictionary accepts formatting options such as
group_header_format (how panel headers are typeset),
tab_width (table width), and tabcolsep (column padding). See the
MTable documentation
for the full list.
Every ModernDiD estimator implements the same plug-in interface, so
results from did_multiplegt, cont_did,
ddd, and drdid all work with
ETable and MTable exactly like the staggered DiD examples above.
The example below uses MTable to build a multi-panel summary table from
staggered DiD results.
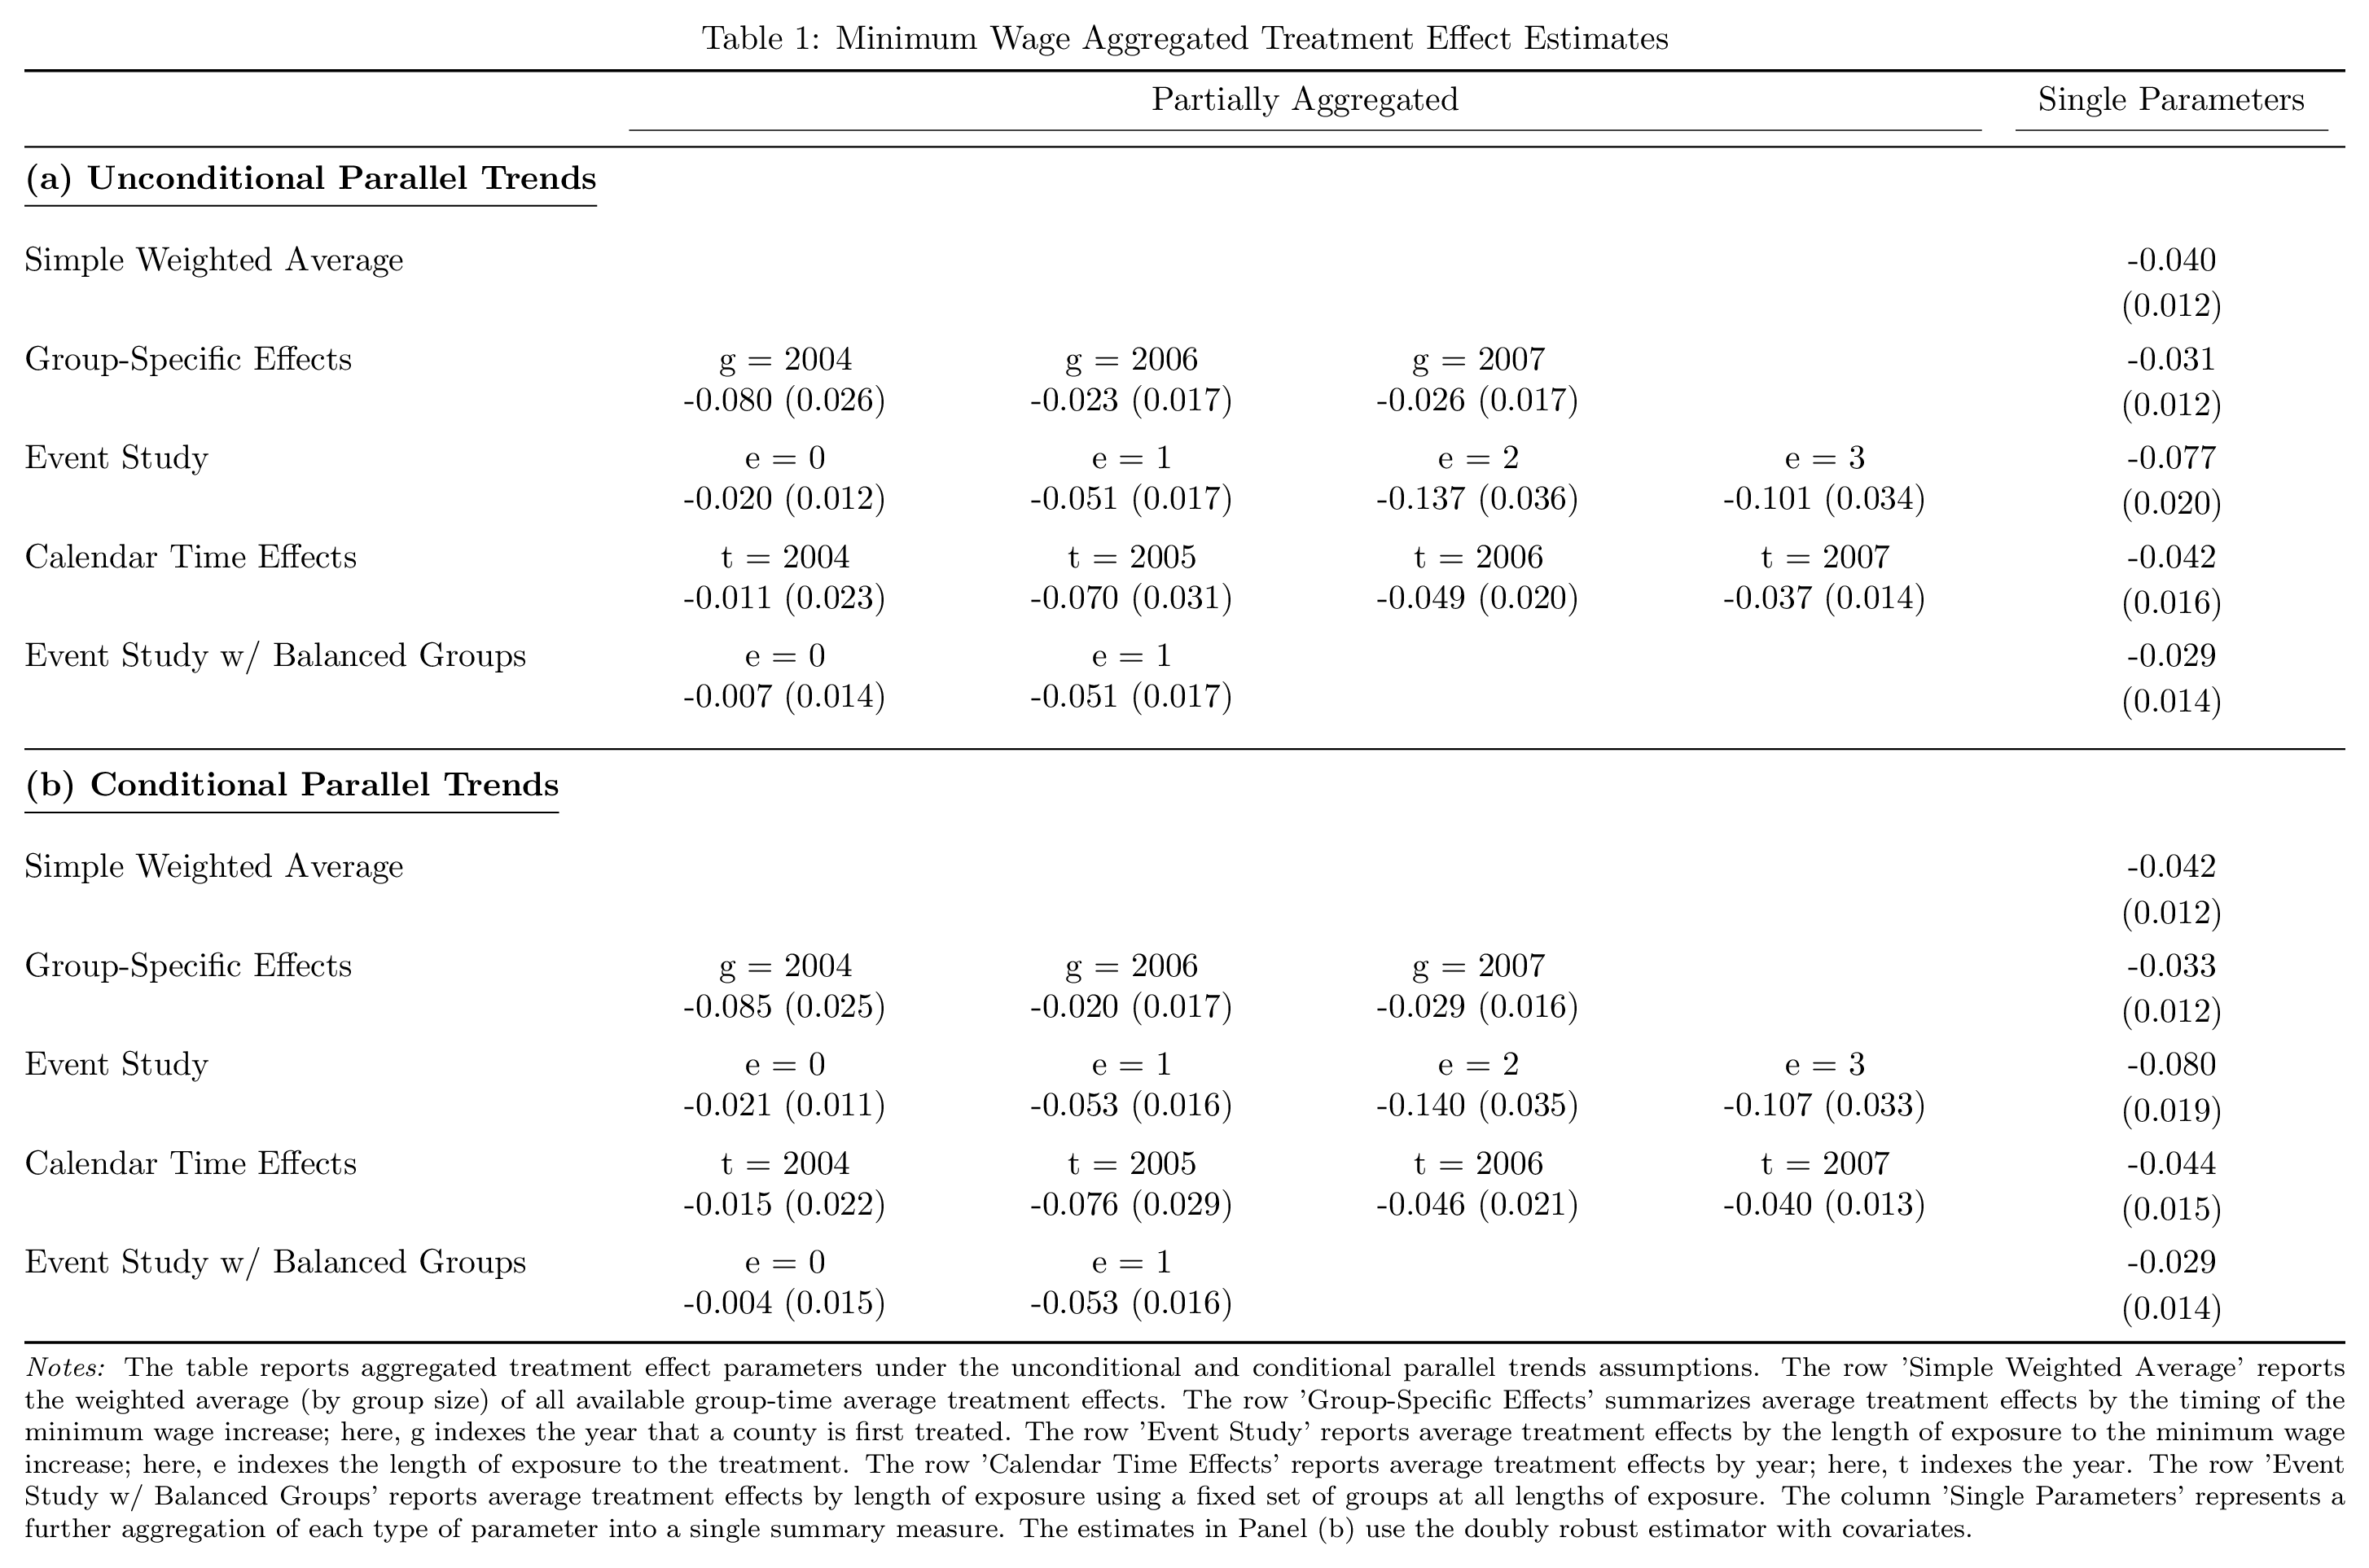
Panel summary with MTable#
The example below shows ATT estimates under unconditional and conditional parallel trends across all four aggregation types (simple, group, dynamic, calendar).
import numpy as np
import pandas as pd
import maketables as mt
import moderndid as did

data = did.load_mpdta()

common = dict(
    data=data, yname="lemp", tname="year", idname="countyreal",
    gname="first.treat", est_method="dr", control_group="nevertreated",
)
attgt_uncond = did.att_gt(**common)
attgt_cond = did.att_gt(**common, xformla="~ lpop")
Compute all four aggregation types for each specification.
specs = {
    "(a) Unconditional Parallel Trends": attgt_uncond,
    "(b) Conditional Parallel Trends": attgt_cond,
}
agg_types = ["simple", "group", "dynamic", "calendar"]
results = {
    label: {t: did.aggte(attgt, type=t) for t in agg_types}
    for label, attgt in specs.items()
}
Each row is one aggregation type within a panel. Cells contain the estimate
and standard error separated by a newline (MTable renders newlines as
\makecell{} in LaTeX). The partially aggregated columns show individual
group/event/calendar values, while the final column shows the overall
parameter.
N_PARTIAL = 4

rows = {
    "simple":   ("Simple Weighted Average",  None),
    "group":    ("Group-Specific Effects",   "g"),
    "dynamic":  ("Event Study",              "e"),
    "calendar": ("Calendar Time Effects",    "t"),
}

row_index = []
table_rows = []
for panel, aggs in results.items():
    for agg_type, (label, prefix) in rows.items():
        r = aggs[agg_type]
        # Sub-estimates (empty for "simple" which has no event_times)
        events = zip(r.event_times or [], r.att_by_event or [], r.se_by_event or [])
        partial = [
            f"{prefix} = {int(v)}\n{att:.3f}\n({se:.3f})"
            for v, att, se in events
        ][:N_PARTIAL]
        partial += [""] * (N_PARTIAL - len(partial))
        # Overall ATT
        row_index.append((panel, label))
        table_rows.append(partial + [f"{r.overall_att:.3f}\n({r.overall_se:.3f})"])
The row MultiIndex creates the two panels; the column MultiIndex
creates the “Partially Aggregated” and “Single Parameters” spanners.
columns = pd.MultiIndex.from_tuples(
    [("Partially Aggregated", " " * (i + 1)) for i in range(N_PARTIAL)]
    + [("Single Parameters", "")],
)
df = pd.DataFrame(
    table_rows,
    index=pd.MultiIndex.from_tuples(row_index, names=["Panel", "Statistic"]),
    columns=columns,
)
Pass the DataFrame to MTable with panel formatting options.
tab = mt.MTable(
    df,
    caption="Table 4: Minimum Wage Aggregated Treatment Effect Estimates",
    notes=(
        "The table reports aggregated treatment effect parameters under the "
        "unconditional and conditional parallel trends assumptions with "
        "clustering at the county level. Entries report estimate (standard error)."
    ),
    rgroup_sep="tb",
    rgroup_display=True,
    tex_style={"group_header_format": r"\textbf{%s}"},
)
tex = tab.make("tex")
See the MTable documentation for the full set of row group, column spanner, and style options.
Output formats#
Both ETable and MTable support multiple output formats. Pass the
format name to make() to render.
# LaTeX
tex = tab.make("tex")

# HTML (via great-tables)
html = tab.make("html")

# Word
doc = tab.make("docx")

# Typst
typst = tab.make("typst")
Each format accepts a style dictionary for fine-grained control.
# LaTeX styling
tex = tab.make("tex", tex_style={"tab_width": r"0.9\\linewidth", "tabcolsep": "2pt"})

# HTML styling
html = tab.make("html", gt_style={"table_width": "100%", "table_font_size_all": "14px"})

# Word styling
doc = tab.make("docx", docx_style={"font_name": "Times New Roman", "font_size_pt": 11})
Calling make() with no type argument auto-displays HTML in Jupyter
notebooks and LaTeX when rendering through Quarto.
tab.make() # auto-detect: HTML in notebooks, LaTeX in Quarto
Tables can be saved directly to files.
tab.save("tex", "results.tex")
tab.save("docx", "results.docx")
To update an existing document in place (matching by tab_label), use
update_tex or update_docx. If no table with the label is found,
the table is appended.
tab.update_tex("paper.tex")
tab.update_docx("paper.docx")
For the full list of rendering and layout options, see the maketables documentation.
Next steps#
Quickstart covers estimation, aggregation, and inference options for staggered DiD.
Estimator Overview surveys all available estimators and their key arguments.
Plotting Guide shows how to build event study figures and other visualizations from the same result objects.
For contributors adding maketables support to a new estimator, see Maketables Functionality in the architecture guide.